
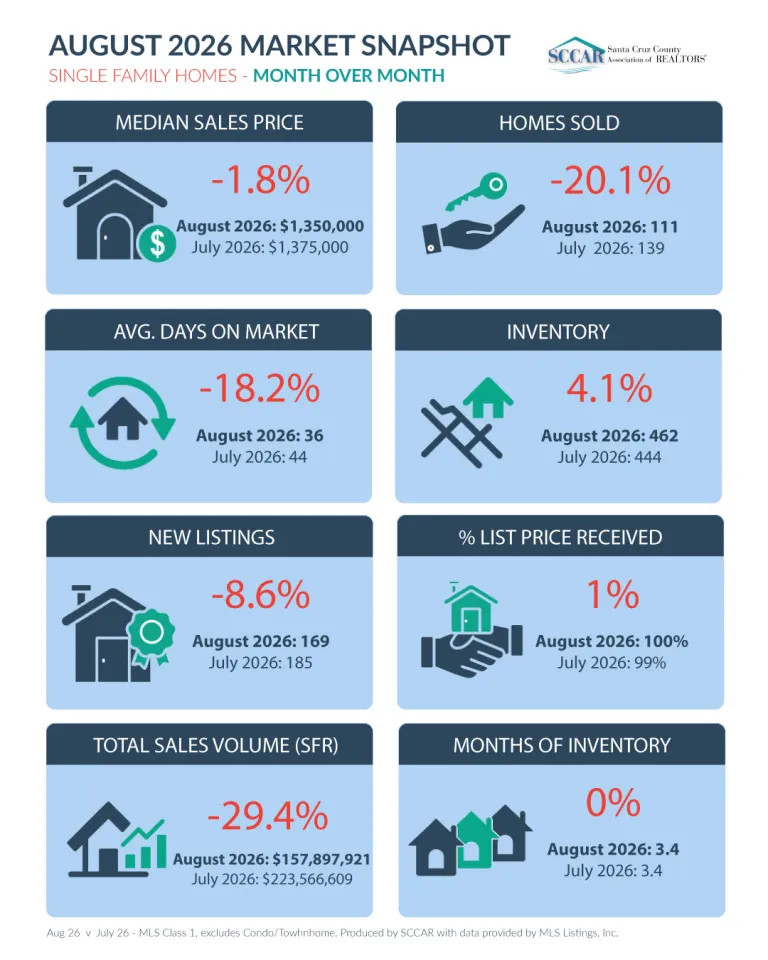
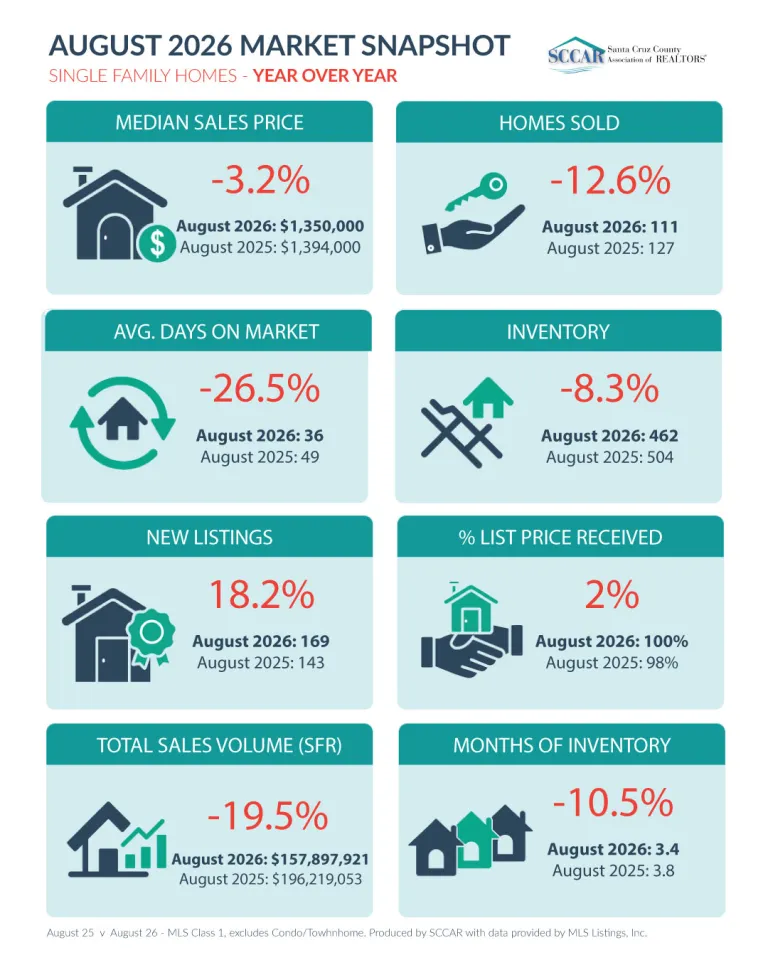
The most useful housing-market question is rarely “Are prices up or down?” A buyer deciding whether to write an offer and a seller deciding how to launch need to understand supply, sales pace, marketing time, and the type of homes actually closing. The latest Santa Cruz County Association of REALTORS® (SCCAR) countywide table, updated for August 2026, offers a clear but nuanced picture: single-family inventory and closed sales reflected typical late-summer adjustments, Days on Market (DOM) stabilized across prime price tiers, the average sale price held strong due to high-end closings, and the median sale price reflected steady underlying demand. That is not a contradiction. It is a reminder that one headline cannot describe every price bracket, neighborhood, or property condition.
Navigating real estate along the Central Coast requires sifting through aggregated figures to understand what is occurring at the street level. Whether you are aiming to buy in Westside Santa Cruz, sell in Scotts Valley, or downsize in Aptos, understanding how market mechanics intersect with localized inventory is the first step toward a successful transaction.
The August 2026 Market Dashboard
To evaluate the housing climate accurately, we start with the primary source of truth for local real estate activity: the official SCCAR Market Statistics database. The data presented below reflects countywide Multiple Listing Service (MLS) reported activity for the month of August 2026 across two primary residential categories: Single-Family Residences (SFR) and Condominiums/Townhomes.
| Metric | Single-Family Residences (SFR) | Condominiums & Townhomes |
|---|---|---|
| Active Inventory | 438 listings | 118 listings |
| New Listings | 172 listings | 44 listings |
| Closed Sales | 131 sales | 32 sales |
| Average Days on Market (DOM) | 48 days | 68 days |
| Average Sale Price | $1,628,400 | $685,200 |
| Median Sale Price | $1,380,000 | $675,000 |
*Data source: Santa Cruz County Association of REALTORS® (SCCAR) MLS reports for August 2026. All statistics reflect countywide residential activity and serve as general informational indicators, not formal property appraisals or financial forecasts.
These baseline numbers illustrate two distinct operational environments within Santa Cruz County. While detached single-family homes continue to trade at substantial valuations with moderate marketing timelines, attached dwellings—condominiums and townhomes—exhibit a slower absorption pace and a compressed price structure.
Year-Over-Year Changes and Their Statistical Limits
Evaluating monthly performance against historical benchmarks reveals key structural shifts in local market behavior. Comparing August 2026 figures to August 2025 highlights noticeable adjustments in supply and demand metrics:
- Single-Family Residence (SFR) Inventory: Active listings experienced a contraction compared to late-summer 2025 levels, dropping down to 438 available single-family listings in August 2026. Closed sales followed suit with 131 completed transactions, while average marketing time held steady near 48 days.
- Condominium & Townhome Performance: Attached housing inventory stood at 118 active listings in August 2026, generating 32 completed sales with an average DOM of 68 days.
- Price Dynamics: Single-family homes recorded a median sale price of $1,380,000, while the average sale price reached $1,628,400.
Understanding Average vs. Median Prices
The divergence between an elevated average sale price ($1,628,400) and a balanced median sale price ($1,380,000) highlights a fundamental principle of real estate statistics: sample composition impacts averages far more than medians.
The median sale price represents the exact midpoint of the market: exactly 50 percent of all closed transactions sold for more than $1,380,000, and 50 percent sold for less. It is the most reliable metric for assessing what a typical homebuyer is paying in the general market.
The average sale price, conversely, is calculated by dividing the total dollar volume of all closed transactions by the total number of sales. In a relatively small monthly sample size—such as 131 single-family closings across an entire county—a handful of high-end oceanfront sales in Aptos, Capitola, or Westside Santa Cruz selling for $5 million to $10+ million can artificially inflate the average price without reflecting broader value shifts for inland or mid-tier residences.
The Hazard of Broad Market Labels
It is tempting to look at contracted inventory and declare an extreme "seller's market," or to point to longer DOM compared to post-pandemic highs and declare a "buyer's market." Both conclusions are overly simplistic.
In a geographic area as topographically and socioeconomically varied as Santa Cruz County, one single ratio or monthly report cannot capture the entire picture. Micro-markets operate under vastly different conditions; a turnkey home in a walkable coastal neighborhood may face competitive bidding within 10 days, while a property requiring substantial infrastructure repairs in the Santa Cruz Mountains may sit for 90 days regardless of macroeconomic headlines.
Days on Market (DOM) vs. Days to Pending
Misinterpreting timing metrics is one of the most common mistakes made by both buyers and sellers. Industry reports frequently blend different measurements, leading to confusion during price negotiations and strategic planning.
Defining DOM as Reported by SCCAR
The Days on Market (DOM) metric published in official SCCAR statistics represents the total number of cumulative days a property is actively listed in the MLS before its status changes to closed/sold. It measures the full duration of public exposure up through escrow execution and completion.
Distinguishing "Days to Pending"
In contrast, Days to Pending (or Days to Contract) measures only the initial window: the exact number of days from the moment a property is published on the MLS until the seller accepts an offer and places the listing into "Pending" or "Under Contract" status.
- Why the distinction matters: A listing might go into pending status after just 14 days on the market due to strong initial interest. However, if the transaction requires a standard 30-to-45-day escrow period for buyer financing, appraisals, and property inspections, its final recorded DOM at closing will show as 44 to 59 days.
- Third-Party Data Note: National real estate portals and third-party data aggregators frequently report "Median Days on Market" while actually tracking Days to Pending.
Third-Party City-Level Metric Box
- Metric Type: Third-Party City-Level Median Days to Pending (e.g., Redfin / Realtor.com local city estimates).
- Scope: Specific municipal boundaries (e.g., City of Santa Cruz or City of Watsonville proper).
- Purpose: Captures the initial velocity of buyer demand—how quickly sellers go under contract.
- Critical Rule: Never blend third-party municipal "Days to Pending" figures with official countywide MLS "Days on Market" (DOM) figures. Doing so distorts timing expectations for listing strategies and escrow durations.
Understanding this distinction builds trust and prevents strategic errors. Sellers who see a 48-day countywide DOM average do not necessarily need to wait 48 days to receive an offer; conversely, buyers should recognize that a property showing 45 days of DOM may simply be reaching the final stages of its closing timeline rather than sitting neglected.
Strategic Implications for Sellers
With single-family DOM averaging 48 days and condo DOM at 68 days for August 2026, sellers must maintain realistic timing expectations. A longer marketing window is not a sign of failure—it is a sign of a market returning to deliberate, qualified decision-making. Panic and automatic price reductions are often counterproductive when grounded in timing misperceptions.
| Property Segment | Strategic Focus |
|---|---|
| Turnkey / Move-In Ready | Professional staging, aggressive launch pricing |
| Unique / Custom Coastal | Targeted regional reach, extended DOM tolerance |
| Deferred Maintenance | Upfront inspections, clear repair credits |
| Condos & Townhomes | HOA document organization, competitive pricing |
- Turnkey Homes: Properties that are fully updated, tastefully staged, and located in prime school districts or beach neighborhoods continue to attract prompt interest. Sellers should focus on flawless launch mechanics—ensuring high-quality visual presentation and setting a price grounded firmly in recent closed comps.
- Unique or Architectural Properties: Architectural, semi-rural, or custom mountain estates naturally appeal to a smaller buyer pool. Sellers must prepare for longer absorption timelines without prematurely slicing the asking price before the target buyer sees the listing.
- Properties with Deferred Maintenance: Today’s buyers are hyper-sensitive to renovation costs and labor delays. Homes needing updates should be paired with pre-sale property, pest, and roof inspection reports. Providing full upfront disclosures builds buyer confidence and prevents contract cancellations during escrow.
- Condominiums and Townhomes: With attached housing DOM averaging 68 days, condo sellers must present clear, organized HOA documents (financial reserves, HOA dues breakdown, insurance coverage details) immediately upon listing to eliminate buyer hesitation.
Evaluating the Competitive Set
Rather than looking solely at historical sold data from six months ago, sellers must continuously analyze their exact active and pending competitive set. Active listings represent your direct competition for buyer attention today; pending listings demonstrate what price points and terms buyers are actively accepting right now.
Strategic Implications for Buyers
While August 2026 single-family active listings totaled 438 homes, an average DOM of 48 days creates meaningful strategic opportunities for buyers. The market offers room for thorough due diligence, thoughtful offer structuring, and calmer negotiations than during historical peaks.
Step 1
Secure Full Mortgage Pre-Approval
Work with a reputable lender to obtain a verified pre-approval letter rather than a simple pre-qualification. Sellers favor buyers who can guarantee underwriting stability.
Step 2
Investigate Insurance Availability Early
Insurance underwriting in California—particularly regarding wildfire exposure—requires early verification. Obtain preliminary hazard insurance quotes prior to writing non-contingent offers.
Step 3
Plan Thorough Property Inspections
Schedule complete physical inspections, including structural, pest, roof, sewer lateral, and geological evaluations where applicable.
Step 4
Maintain Offer Discipline
Craft purchase agreements with balanced terms that protect your earnest money deposit while remaining competitive on price and escrow duration.
Finding Value Beyond Fresh Listings
Buyers who limit their search to brand-new inventory miss out on valuable options. Properties with 40, 60, or 90+ DOM, as well as listings that have returned to the market after a failed escrow, deserve close consideration.
An extended DOM rarely indicates a fundamental flaw with the home itself; more often, it reflects initial overpricing, ineffective marketing, or a previous buyer's personal financing hurdle. Buyers who evaluate these listings objectively often find motivated sellers and opportunities to negotiate favorable purchase prices or seller-paid rate buy downs.
The Micro-Market Overlay: Why Location and Type Drive Results
Countywide market figures summarize broad dynamics across diverse geography. Santa Cruz County spans distinct environmental, regulatory, and micro-economic zones that shape property values independently of countywide trends.
Coastal Urban Communities
(Westside, Seabright, Aptos)- Walkability to beaches and coastal attractions
- Strict building constraints maintaining scarcity
- Higher average price-per-square-foot ratios
- Strong year-round buyer demand
Inland & Mountain Communities
(Felton, Boulder Creek, etc.)- Larger lot sizes, privacy, and usable acreage
- Wildfire risk and insurance considerations
- Private septic and well system evaluations
- Value-driven, lower cost-per-square-foot price points
- Coastal vs. Mountain Properties: A single-family home in coastal Seabright or Lower Westside benefits from ocean proximity, high walkability, and severe land constraints, keeping supply tight and demand high. Conversely, properties in the San Lorenzo Valley (Felton, Ben Lomond, Boulder Creek) offer larger acreage and lower price-per-square-foot ratios, but require careful evaluation of septic systems, private wells, and defensible space requirements.
- Santa Cruz City vs. Scotts Valley: Santa Cruz proper experiences demand driven by beach lifestyle, coastal access, and proximity to UC Santa Cruz. Scotts Valley, situated along the Highway 17 corridor, draws buyers focused on commuter convenience to Silicon Valley, top-rated public school districts, and micro-climates with warmer, sunnier weather.
- Turnkey detached homes vs. Condominiums: As shown in the August 2026 data, detached homes posted a median sale price of $1,380,000 with a 48-day DOM, while condominiums recorded a median price of $675,000 with a 68-day DOM. Broad sweeping statements about "Santa Cruz real estate" blend these two distinct product types together, muddying the reality of both.
Because macro-level statistics cannot resolve these micro-market nuances, buyers and sellers should always request a customized analysis tailored to their target neighborhood or specific property address.
Actionable Next Steps for Your Move
Whether you are preparing a home for sale or searching for your next property, successful real estate outcomes rely on detailed local analysis rather than generic market headlines.
For Sellers: Micro-Market Review
Schedule a Custom Neighborhood Market Review to analyze active competition, pending sale terms, and precise comparative market data for your specific street.
Request Market ReviewFor Buyers: Strategy Session
Request a Purchaser Strategy Session to refine your target criteria, align pre-approval parameters, and establish tracking for key opportunities.
Schedule Strategy SessionKey Resources & Essential Reading
Editorial & Compliance Notes: Real estate market statistics compiled in this report are derived from MLS data published by the Santa Cruz County Association of REALTORS® (SCCAR) for August 2026. All data is provided strictly for general informational and educational purposes. Market figures do not constitute a formal property appraisal, financial recommendation, or prediction of future market performance. Real estate buyers and sellers are advised to verify property-specific details, zoning regulations, permit histories, insurance availability, tax implications, and financing terms with qualified, licensed professionals.


Paul Burrowes, CRS, CCEC, SFR, NHCP, LHC, REALTOR® With over fifteen years of experience and an elite list of credentials, Paul Burrowes is a REALTOR® dedicated to merging deep local expertise with modern innovation. Paul leverages the latest technology and AI-driven insights to provide his clients with the most accurate, data-rich information available in the Santa Cruz, Monterey, Santa Clara, and Silicon Valley markets. He serves as a personal adviser, skilled negotiator, and detail-oriented advocate, ensuring every transaction—from initial question to final signature—goes off without a hitch. Contact Paul at paul@burrowes.com, (831) 295-5130, (408) 497-3989, or DRE# 01955563.
Disclaimer: This article was developed with the assistance of AI technology to synthesize market data, then reviewed, edited, and verified for accuracy by Paul Burrowes to ensure it meets the highest professional standards.
Enjoy this blog post? Click here to subscribe for updates
Leave A Comment